File:Lagrange points.jpg
Size of this preview: 685 × 599 pixels. Other resolutions: 274 × 240 pixels | 549 × 480 pixels | 878 × 768 pixels | 1,170 × 1,024 pixels | 2,400 × 2,100 pixels.
Original file (2,400 × 2,100 pixels, file size: 709 KB, MIME type: image/jpeg)
Captions
Captions
Add a one-line explanation of what this file represents

|
File:Lagrange points2.svg is a vector version of this file. It should be used in place of this JPG file when not inferior.
File:Lagrange points.jpg → File:Lagrange points2.svg
For more information, see Help:SVG. |
 |
Summary
edit
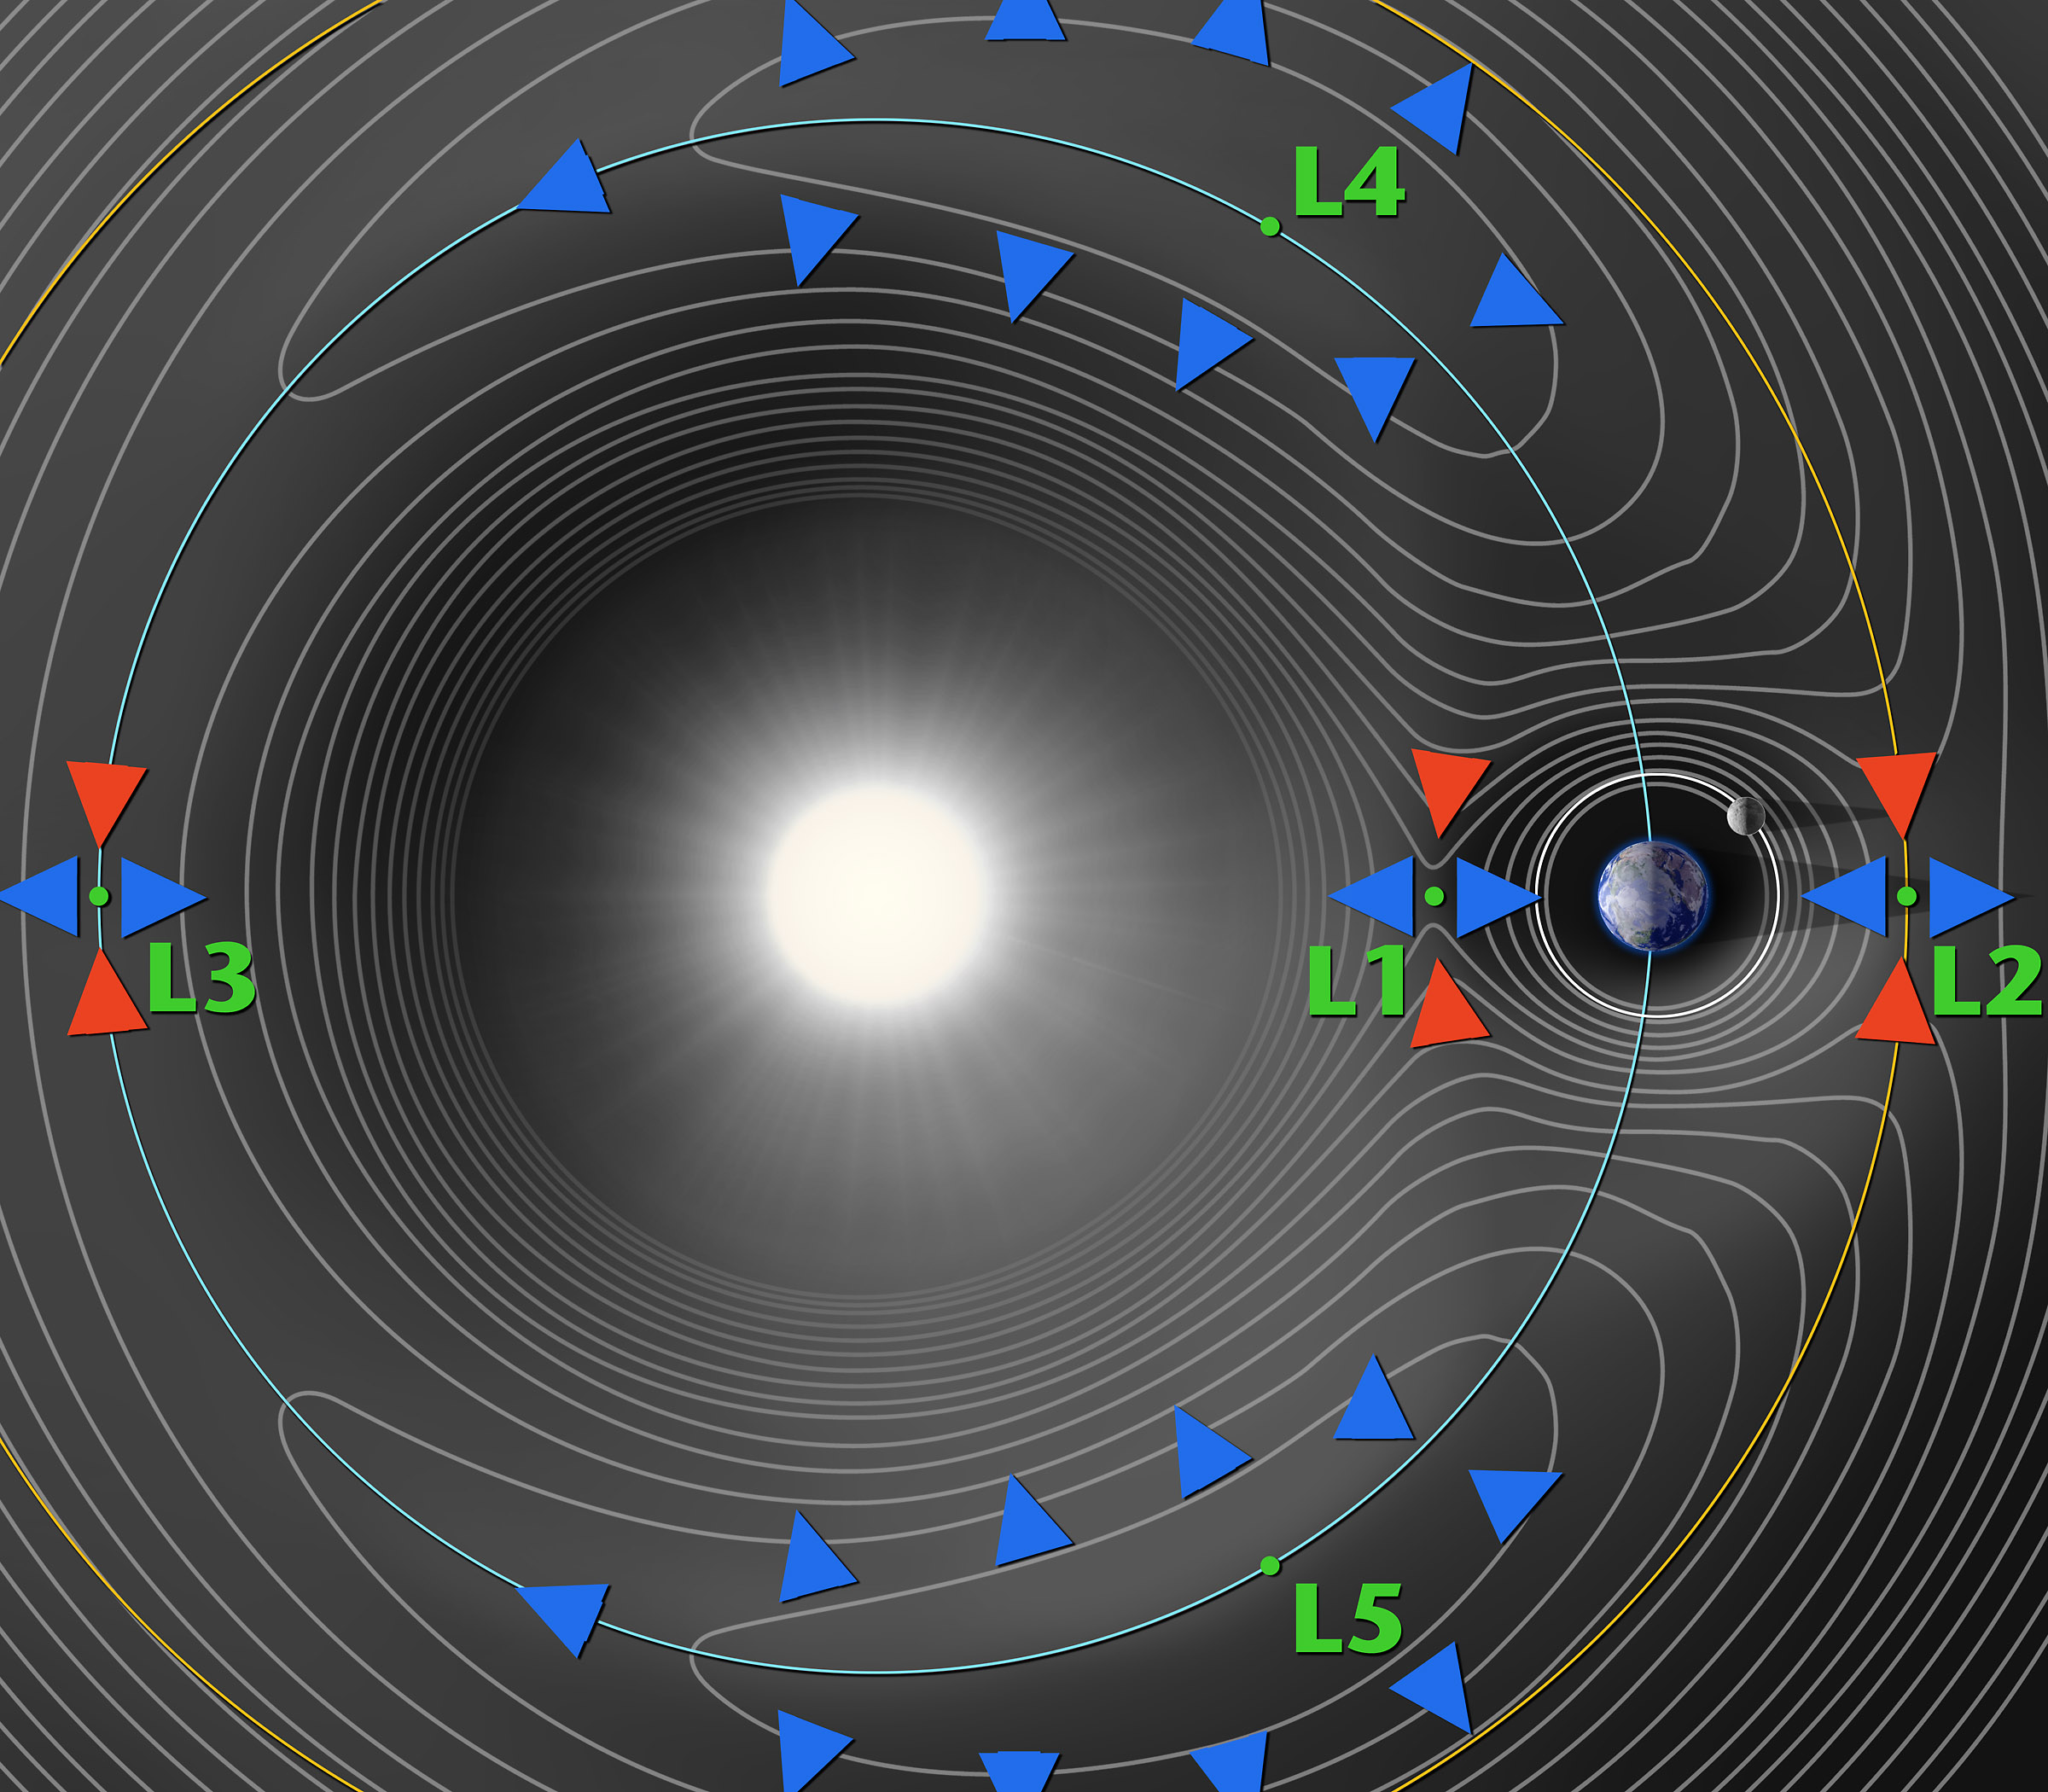
| Description | A (not drawn to scale!) contour plot of the effective potential of a two-body system. (the Sun and Earth here), showing the 5 Lagrange points. An object orbiting in free-fall could trace out a contour (such as the Moon, shown). |
| Date | Unknown date |
| Source | http://map.gsfc.nasa.gov/m_mm/ob_techorbit1.html - Retrieved March 31, 2006. |
| Author | NASA |
Licensing
edit
| This file is in the public domain in the United States because it was solely created by NASA. NASA copyright policy states that "NASA material is not protected by copyright unless noted". (See Template:PD-USGov, NASA copyright policy page or JPL Image Use Policy.) | ||
 |
Warnings:
|
File history
Click on a date/time to view the file as it appeared at that time.
| Date/Time | Thumbnail | Dimensions | User | Comment | |
|---|---|---|---|---|---|
| current | 23:35, 16 March 2011 | | 2,400 × 2,100 (709 KB) | Antonsusi (talk | contribs) | Higher resolution |
| 15:12, 5 February 2007 |  | 489 × 419 (62 KB) | EnEdC (talk | contribs) | also move L4, L5 out | |
| 00:37, 29 June 2006 |  | 489 × 419 (62 KB) | EnEdC (talk | contribs) | Moved L3 left slightly. | |
| 17:53, 31 March 2006 |  | 479 × 419 (49 KB) | Mlm42~commonswiki (talk | contribs) | A contour plot of the effective potential of a two-body system. It clearly shows the 5-lagrange points. |
You cannot overwrite this file.
File usage on Commons
The following 3 pages use this file:
File usage on other wikis
The following other wikis use this file:
- Usage on ar.wikipedia.org
- Usage on arz.wikipedia.org
- Usage on bs.wikipedia.org
- Usage on ca.wikipedia.org
- Usage on cs.wikipedia.org
- Usage on cv.wikipedia.org
- Usage on da.wikipedia.org
- Usage on de.wikipedia.org
- Usage on de.wikibooks.org
- Usage on en.wikipedia.org
- Usage on eo.wikipedia.org
- Usage on es.wikipedia.org
- Usage on et.wikipedia.org
- Usage on fa.wikipedia.org
- Usage on fi.wikipedia.org
- Usage on fr.wikipedia.org
- Orbite
- Satellite artificiel
- Planck (télescope spatial)
- Herschel (télescope spatial)
- Portail:Astronautique
- Portail:Astronautique/Articles
- Utilisateur:Wikisoft*/Astronautique
- Colonisation de l'espace
- Utilisateur:Pline/Portail:astronautique
- Utilisateur:Pline/Portail:Astronautique/Articles
- Utilisateur:MG/Page20
- Colonisation des points de Lagrange
- Usage on he.wikipedia.org
- Usage on hu.wikipedia.org
- Usage on hy.wikipedia.org
View more global usage of this file.